Table of Contents
What are Contour Lines and Topographic Maps?
Contour Lines
Ever noticed those squiggly lines all over your hiking map? Other than the obvious trails and rivers, these squiggly lines are contour lines. Put simply, contour lines mark points of equal elevation on a map.
If you trace the length of a line with your finger, each point you touch is the same height above sea level. If you were to walk the path of a contour line in real life, you would remain at the same elevation the whole hike, never traveling up or down.
Contour lines are critical to understanding the elevation profile of your terrain or a particular land formation. This information can be helpful when selecting a hiking route... or lifesaving in a desperate survival situation. Beyond backpacking and hiking, countless other professions use them - land surveyors, foresters, engineers, miners, geologists, hunters, to name a few.
Topographic Maps
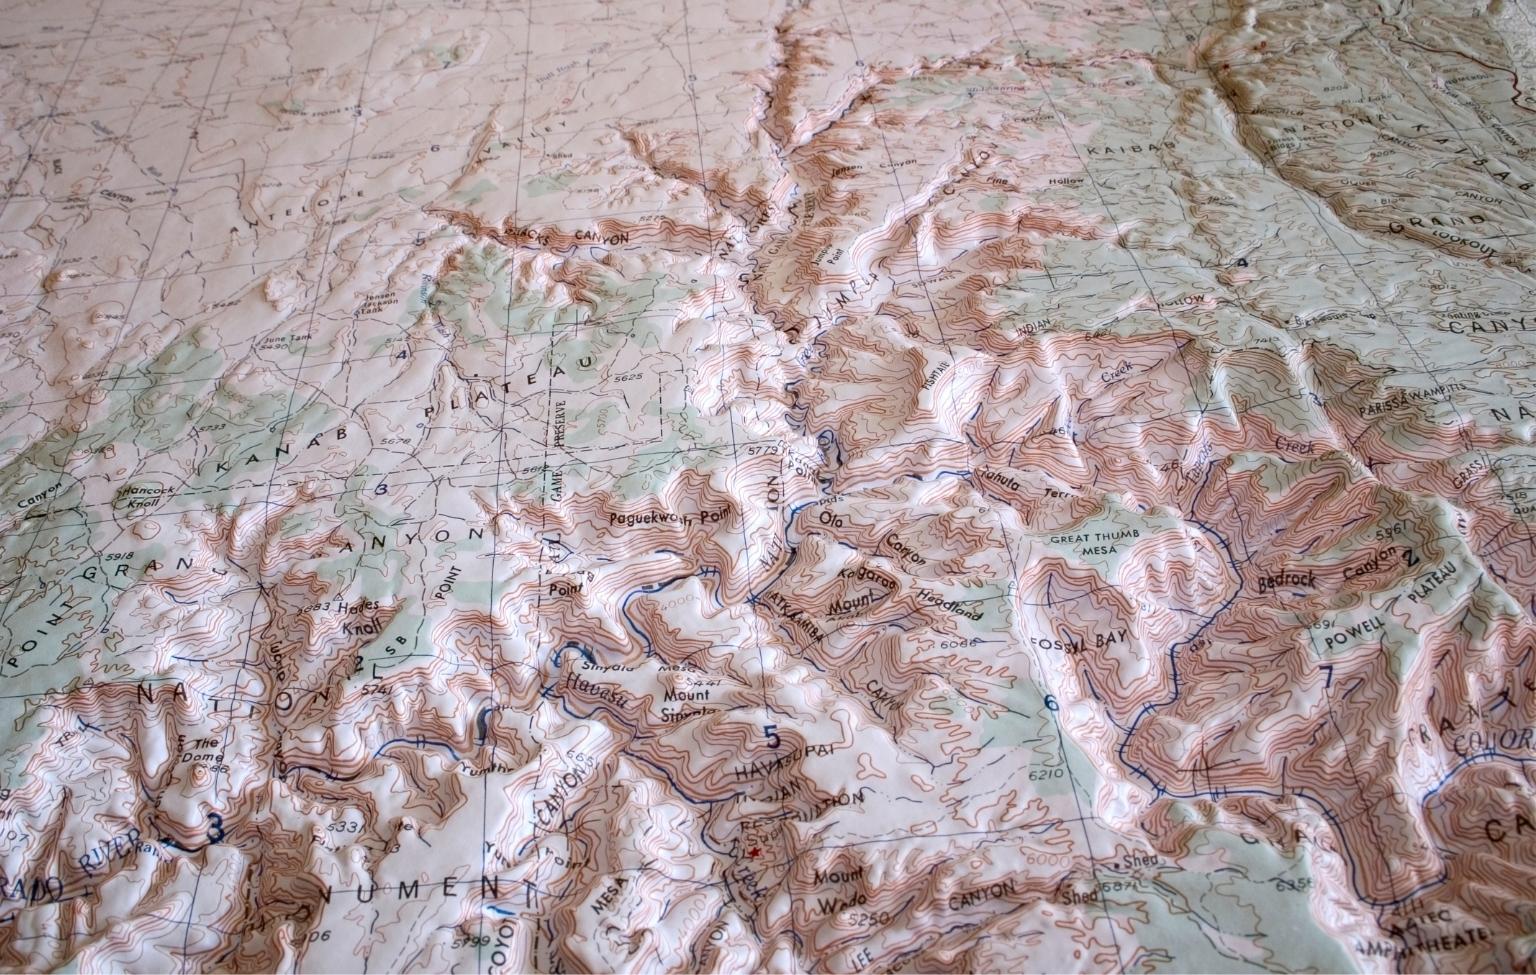
Topography is the study of geographical features on a landscape. A map with contour lines on it is called a topographic map. Topographic maps use a combination of colors, shading and contour lines to represent changes in elevation and terrain shape. Essentially, topographic maps represent the three-dimensional landscape of Earth within the two-dimensional space of a map.
Credit: ThingLink
The first known maps to include geographical features were found in Ancient Rome. It would be thousands of years before cartographers (map makers) could chart large areas of terrain with any real accuracy. Contour lines, as we know them today, came into popular use in the mid-1800s along with the rise of resource extraction industries like mining and logging.
Understanding Line Formations
After reading contour lines on a map for a while, you’ll notice that a few distinct shapes pop again and again. Learning to identify common contour line formations will help you read topo maps quickly, and recognize the various terrain features they represent on a map. Let's dig into 'em.

A. Peak Ring. The innermost ring at the center of several contour loops almost always represents a peak (highest elevation). Sometimes the peak will be represented with a small X and number denoting elevation.
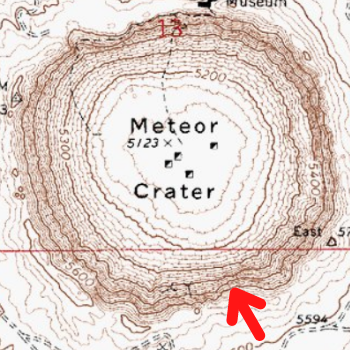
B. Depression Ring. Occasionally, however, an inner ring indicates a depression (lowest elevation), which the map will show with a series of small tick marks pointing toward the center (called hachures).
Closed loops without hachures are always uphill on the inside and downhill on the outside. This is known as the “Rule of O’s”. This means hills and mountains will appear on the map as a cluster of concentric O shapes.
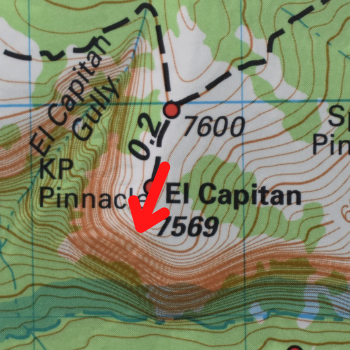
C. Cliff. If you see two or more lines converge until they appear as a single line, this represents a cliff. Use caution, however - some cliffs may not appear on the map. If your contour interval was 50 feet, a cliff of 40 feet might not appear on the map, since the elevation doesn’t change enough to warrant a new contour line.
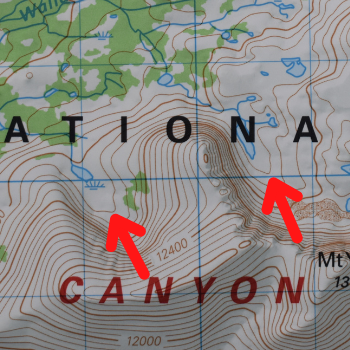
D. Valley. When contour lines cross a valley or a stream, they make a sharp pointed V or U-shape. Rivers, of course, are represented by blue lines that will run through the center of the V-shape. Sometimes called draws, the V-shape of this feature always points towards their peak.
You can also use a topographic map to determine the direction the river is flowing. Because water flows downhill, the V-shape always points in the opposite direction that the water is flowing. This is called the “Rule of V’s”.

E. Ridgeline. Think of a ridgeline like an elongated peak, not coming to a fine point. Instead of a closed inner circle, a ridgeline can look like a big oval.
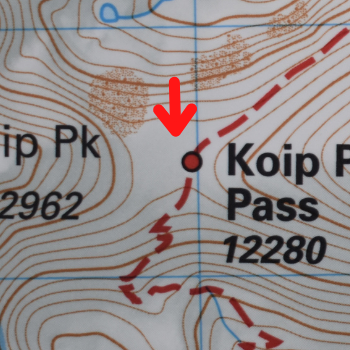
F. Saddle. A saddle is a low lying area between two higher points of elevation. Identifying saddles can show you the quickest route through hilly areas. They appear as hourglass shapes between two concentric circles.
How To Read Contour Lines
A quick glance at a topographic map will give you a general idea of the landscape. Is it flat or mountainous?
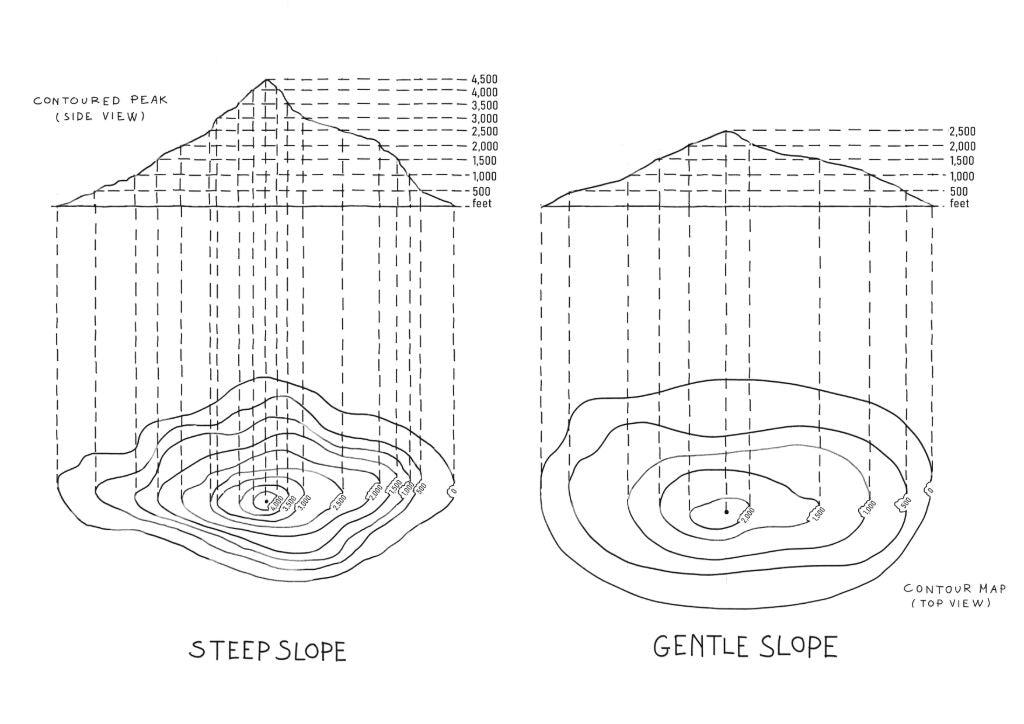
If each line represents an equal point of elevation, then any change in elevation would lead to inconsistent line spacing, right? For example, several contour lines spaced close together would indicate steep terrain, while lines spaced far apart would indicate a gentler slope.
Let's dig deeper. There are 3 kinds of contour lines you’ll see on a map: intermediate, index, and supplementary.
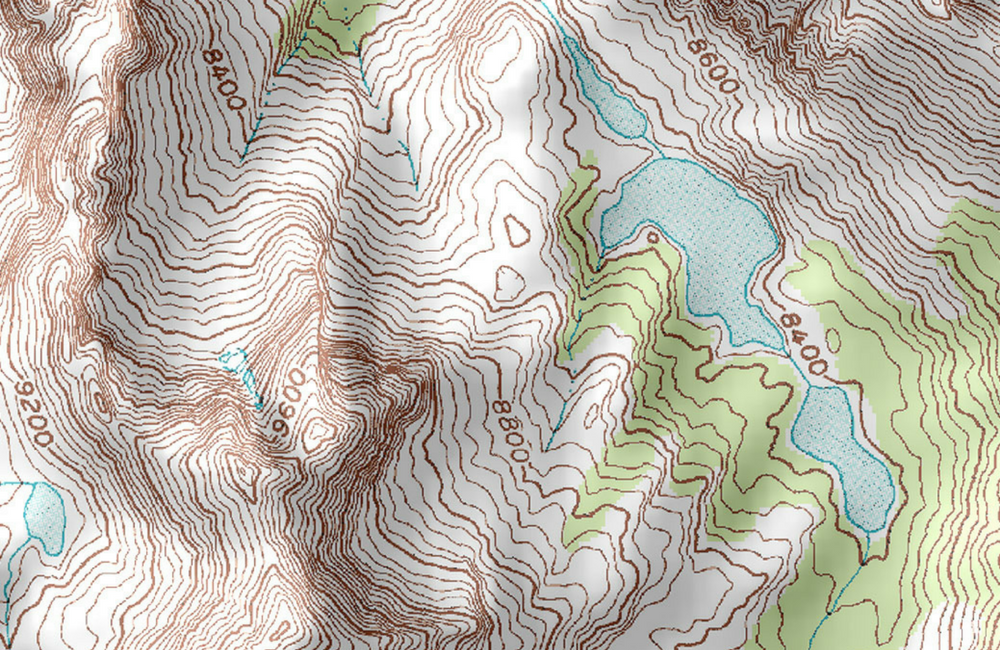
1. Index lines are the thickest contour lines and are usually labeled with a number at one point along the line. This tells you the elevation above sea level.
2. Intermediate lines are the thinner, more common, lines between the index lines. They usually don't have a number label. Typically one index line occurs for every five intermediate lines.
3. Supplementary lines appear as dotted lines, indicating flatter terrain.

If you’re looking at an index line, it's easy to read the elevation because it is clearly labeled. However, interval lines are somewhat trickier. To determine their elevation, you’ll need to know the contour intervals. Contour intervals tell you the change in elevation between any two contour lines.
You can find the contour interval in the map key, usually located underneath the scale of the map at the bottom center. To understand all map symbols, see the US Gov document.

Example: The contour interval is 50 feet according to the map key. You want to find out the elevation of an intermediate line 3 lines above an index line labeled 1,000. For each line above this index line, elevation increases 50 feet. Therefore, the interval line in question is at 1,150 feet above sea level.
Topographic Map Tools
Of course, paper maps aren’t the only topographic tool out there. Smartphone apps and computers can provide any topographic map you may need quickly and accurately, even beyond the reach of wifi and cell signals.

Google Maps. You can turn their topographic view (complete with contour lines) by selecting the “Terrain” layer from the options menu.
Gaia. iPhone users can use Gaia GPS. It is an elegantly designed map program with topographic maps available for download. You can download the maps when you have data or wifi before you venture off-grid. The app itself is free, but membership (which is required for offline topo maps) is $9.99. The app is also available to buy on Android.
Backcountry Navigator. Fear not, Android users. The app Backcountry Navigator provides the same service, with a similar setup. The demo version of the app is free. But, again, the ability to download maps for offline use is $11.99.
Caltopo. My favorite. It is a free, browser-based map tool that allows you to print out custom topo maps... or transfer them to your GPS device. Originally designed for search-and-rescue, Caltopo offers a lot of customization. You can free-draw routes and switch between different types of topography like shading, contours and satellite images. It also allows collaboration with other users and online sharing of your custom maps.
Mytopo. Similar to Caltopo, but mostly focuses on the US and Canada. They provide detailed custom maps, including topo maps, satellite images and public land hunting maps of any region in the US. Super professional quality maps, which you can view online for free or have shipped as high-quality prints for a small fee.
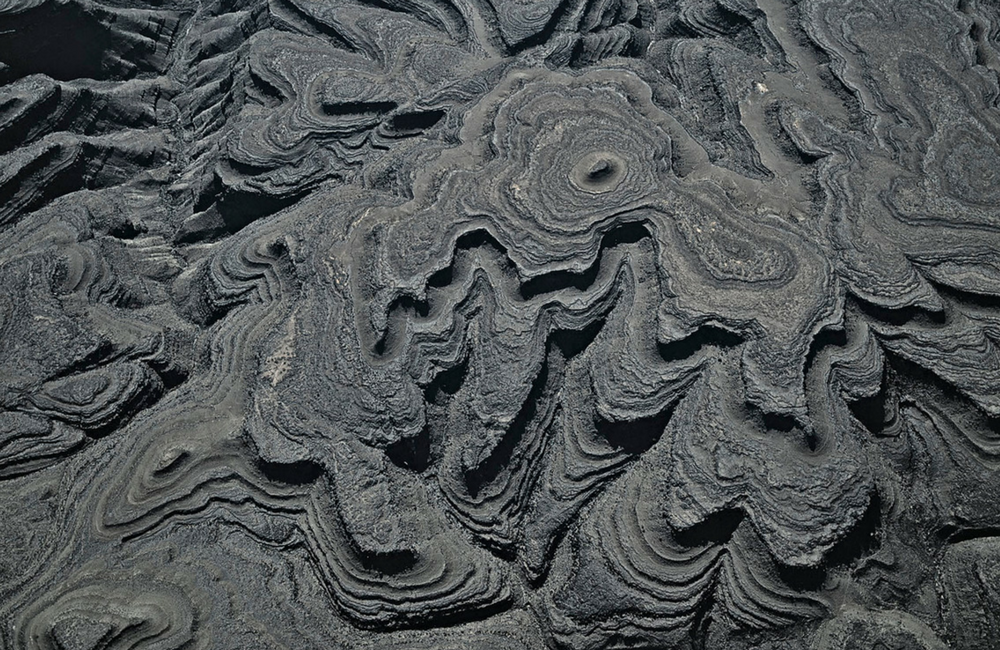
Credit: Bernhard Edmaier
FAQs
How to determine if an off-trail section is too steep from the topo map?
Degrees of steepness
The closer together the contour lines on your map are, the steeper the slope. Looking at how many feet per mile you are gaining or losing is a good way to estimate how steep a trail will be. Gradual climbs have less than 500ft/mi, moderate have 500-800ft/mi, steep climbs have 800-1,000, and anything over 1,000ft/mi is considered extremely steep.
The trail grade is another way to assess how steep a climb will be. If a climb has a 10% grade it means the trail gains 10 feet of elevation for every 100 linear feet. Examples of grades are 5% for a wheelchair ramp, 40% for home stairs, and 75% for a ladder.
Other considerations
Topo maps are a great tool to determine steepness, but there are times when maps can come up short. In the USA, most topos maps have a 40-foot interval between lines. This means if a cliff is less than 40 feet high it can be hidden on the map. Ravines are another small and hard to navigate feature to watch out for.
Always use a map with the smallest possible contour intervals to avoid surprises. Ideally, no greater than 1:24k in scale. Knowing the geology and reading trail reports can help you learn if hard to navigate features are common in the area.

Ways to check the steepness of an off-trail section before you hike:
Mapping software is a great resource to analyze off-trail routes when doing your research. CalTopo has a slope angle shading feature that can be overlaid on a topo map. This helps to determine if a route is too steep. It also helps to visualize gentler slopes in the area which can save you time hiking on easier terrain.
Cross-checking multiple topo maps can highlight differences and offer clues on an area’s terrain. United States Forest Service maps, United States Geological Survey maps, and maps in your mapping software are examples. If you save your route as a KLM file you can overlay it into Google Earth. This allows you to look at the satellite maps of your route in 3D.
Using past hiking experience can help you recognize equivalent terrain. By looking at topo maps of previous hikes you can compare with the new trail you are considering to determine how steep it will be.

Why do contour lines never cross?
Contour lines never cross because they represent a specific elevation at a given point. If they crossed it would indicate that a point would have two elevations at the same time. This is physically impossible, so they can never cross.
How do contour lines show stream direction?
Contour lines show stream direction with the V-shaped lines through which you see the streams and rivers run through on a topo map. Because water flows downhill, the V-shape always points in the opposite direction that the water is flowing. This is called the “Rule of V’s”.
Contour Lines vs. Relief
Contour lines show the elevation above sea level at a given point on your map. Relief shows the difference in elevation between two points on a map. By subtracting the elevation difference between two points you can estimate the relief or elevation change.
Shaded relief, or terrain shading, is a technique used to give contour maps a 3D feel. By lightly shading one side of features like valleys and ridges to make the terrain more easily visualized to your eyes.

 650-Calorie Fuel